Housing inventory is not to be overlooked when trying to understand the real estate market.
Why Are Inventory Levels Important To Understand?
Monthly Inventory measures the absorption rate of a market and gives you insight into the pulse of that particular market.
This figure measures how long (in months) it will take for the current inventory of homes on the market to sell based on the pace of sales from the last 12 months. This assumes no new homes come to the market.
It’s important to understand inventory levels and to keep track of them as it gives you a clear insight into:
- How competitive a market is
- Whether buyers or sellers have the upper hand.
According to the National Association of Realtors® and their article, Existing-Home Sales Decrease 2.5% in November (Click Here).
Total housing inventory is down to 2.3 months of inventory. “Unsold inventory sits at an all-time low 2.3 month supply at the current sales pace, down from 2.5 months in October and down from the 3.7 month figure recorded in November 2019.”
For those following the quarterly Benson Analytics, LLC reports, you have an understanding of how inventory (or the lack thereof) impacts pricing. While we work on closing out 2020, feel free to read the Q3 2020 report below:
As detailed in the “Year-to-Date Performance” breakdown on page 6 of the Q3 2020 report, Harris County (Houston’s primary county) has had 13.5% fewer total active listings and over 5% fewer new listings.
It’s important to also note that through Q3 2020, Harris County experienced an increase in sales by just over 1% year-over-year.
As often emphasized, you need to look at the market in the most granular way possible, so I urge you to check out the report to see how different markets performed in terms of housing inventory.
Houston Inventory Is Low, But How Crazy Is It Really??
Inventory levels in Houston (Harris County) have tightened making it a more competitive housing market. How does it compare with other major areas in Texas?
For this, we will be looking at the following Counties:
- Austin, Texas (Travis County)
- San Antonio (Bexar County)
- Dallas (Dallas County)
- Ft. Worth (Tarrant County)
- Houston (Harris County)
When looking at 2019 v 2020 YTD (thru Nov.) for Monthly Inventory of Single-Family Homes Only, the table below shows you how these areas compare.

With a decrease of 1+ month of inventory, each County has been impacted; however, the fact that Travis County is at 0.6 months of inventory (down from 1.7 months) is really eye opening.
This means that if no new listings hit the market, then the entire inventory of single-family homes will have been purchased (or under contract) in just over half a month in Travis County.
Compared with Harris Co. at 2.2 months or even Bexar and Dallas Counties, that is a blistering pace!
At 2.2. months of inventory, this is the lowest inventory has been in Houston (Harris Co.) since tracking this data back in January 2017. Compared with the NAR statistics shared earlier, Houston (Harris Co.) is slightly below the national average.
Low Inventory = More Competition = Price Increases
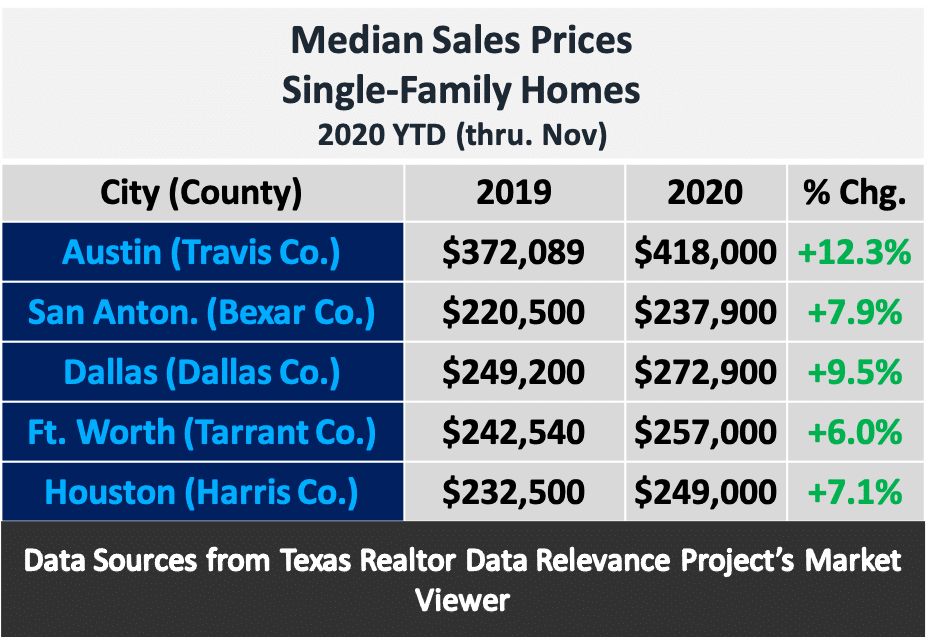
As basic supply/demand economics tells us, when supply of homes are low and demand is high (as was in 2020), prices will rise. Let’s see how these areas compare:

Prices are up in ALL counties, but the areas with the lowest inventory levels have had the highest increases in median sales prices of single-family homes.
Looking ahead, it will be important to keep an eye on new listings hitting the market as that will have an impact on inventory levels. Keep an eye out for the Q4 2020 Market Report as well as the Year-End Report.
Data used in this article has been sourced from the Texas REALTOR® Data Relevance Project, a partnership among Texas REALTORS® and local REALTOR® associations throughout the state. Analysis provided through a research agreement with the Real Estate Center at Texas A&M University. For more, click here.


